More: ![]()
![]()
Carbon Stocktake
Global carbon emissions in 2023 | Nature Reviews Earth & Environment, April 4, 2024
![]()
Zhu Liu, Zhu Deng, Steven J. Davis & Philippe Ciais
Global CO2 emissions for 2023 increased by only 0.1% relative to 2022 (following increases of 5.4% and 1.9% in 2021 and 2022, respectively), reaching 35.8 Gt CO2. These 2023 emissions consumed 10–66.7% of the remaining carbon budget to limit warming to 1.5°C, suggesting permissible emissions could be depleted within 0.5–6 years (67% likelihood). ![]()

Assessment of methane emissions from oil, gas and coal sectors across inventories and atmospheric inversions | Communications Earth & Environment volume, January 9, 2024
![]()
Kushal Tibrewal, Philippe Ciais, Marielle Saunois, Adrien Martinez, Xin Lin, Joel Thanwerdas, Zhu Deng, Frederic Chevallier, Clément Giron, Clément Albergel, Katsumasa Tanaka, Prabir Patra, Aki Tsuruta, Bo Zheng, Dmitry Belikov, Yosuke Niwa, Rajesh Janardanan, Shamil Maksyutov, Arjo Segers, Zitely A. Tzompa-Sosa, Philppe Bousquet & Jean Sciare
Changes in terrestrial carbon storage under environmental and land-use changes remain a critical source of Emissions from fossil fuel exploitation are a leading contributor to global anthropogenic methane emissions, but are highly uncertain. The lack of reliable estimates hinders monitoring of the progress on pledges towards methane reductions. Here we analyze methane emissions from exploitation of coal, oil and gas for major producing nations across a suite of bottom-up inventories and global inversions. Larger disagreement in emissions exists for the oil/gas sector across the inventories compared to coal, arising mostly from disparate data sources for emission factors. Moreover, emissions reported to the United Nations Framework Convention on Climate Change are lower than other bottom-up and inversion estimates, with many countries lacking reporting in the past decades. Finally, comparison with previous global inversions, revealed a strong influence of the prior inventory on the inferred sub-sectoral emissions magnitude. This study highlights the need to improve consensus on the methodological inputs among the bottom-up inventories in order to obtain more consistent inverse modelling results at the sub-sectoral level. ![]()

Global increase in biomass carbon stock dominated by growth of northern young forests over past decade | Nature Geoscience, October 2, 2023
![]()
Hui Yang, Philippe Ciais, Frédéric Frappart, Xiaojun Li, Martin Brandt, Rasmus Fensholt, Lei Fan, Sassan Saatchi, Simon Besnard, Zhu Deng, Simon Bowring & Jean-Pierre Wigneron
Changes in terrestrial carbon storage under environmental and land-use changes remain a critical source of uncertainty in regional and global carbon budgets. We generated global maps of annual live vegetation biomass using L-band microwave vegetation optical depth. Globally, biomass carbon stocks increased from 2010 to 2019 at a rate of 0.50 ± 0.20 PgC yr−1 with a year-to-year variability, closely mirroring the observations of the global atmospheric CO2 growth rate. The main contributors to the global carbon sink are boreal and temperate forests, while wet tropical forests are small carbon sources, from deforestation and agriculture-related disturbances. We found that the tropical deforested and degraded old-growth forests (>140 yr) are nearly carbon neutral whereas temperate and boreal young (< 50 yr) and middle-aged (50–140 yr) forests are the largest sinks. By contrast, dynamic global vegetation models show that all old-growth forests are large sinks and largely ignore the impacts of deforestation and degradation on tropical biomass. Our findings highlight the importance of forest demography when predicting dynamics of future carbon sink under changing climate. ![]()

Monitoring global carbon emissions in 2022 | Nature Reviews Earth & Environment, March 13, 2023
![]()
Zhu Liu, Zhu Deng, Philippe Ciais & Steven J. Davis
Global CO2 emissions for 2022 increased by 1.5% relative to 2021 (+7.9% and +2.0% relative to 2020 and 2019, respectively), reaching 36.1 GtCO2. These 2022 emissions consumed 13%–36% of the remaining carbon budget to limit warming to 1.5 °C, suggesting permissible emissions could be depleted within 2–7 years (67% likelihood). ![]()

National CO2 budgets (2015–2020) inferred from atmospheric CO2 observations in support of the Global Stocktake | Earth System Science Data, March 7, 2023
![]()
Brendan Byrne, David F. Baker, Sourish Basu, Michael Bertolacci, Kevin W. Bowman, Dustin Carroll, Abhishek Chatterjee, Frédéric Chevallier, Philippe Ciais, Noel Cressie, David Crisp, Sean Crowell, Feng Deng, Zhu Deng, Nicholas M. Deutscher, Manvendra K. Dubey, Sha Feng, Omaira E. García, David W. T. Griffith, Benedikt Herkommer, Lei Hu, Andrew R. Jacobson, Rajesh Janardanan, Sujong Jeong, Matthew S. Johnson, Dylan B. A. Jones, Rigel Kivi, Junjie Liu, Zhiqiang Liu, Shamil Maksyutov, John B. Miller, Scot M. Miller, Isamu Morino, Justus Notholt, Tomohiro Oda, Christopher W. O’Dell, Young-Suk Oh, Hirofumi Ohyama, Prabir K. Patra, Hélène Peiro, Christof Petri, Sajeev Philip, David F. Pollard, Benjamin Poulter, Marine Remaud, Andrew Schuh, Mahesh K. Sha, Kei Shiomi, Kimberly Strong, Colm Sweeney, Yao Té, Hanqin Tian, Voltaire A. Velazco, Mihalis Vrekoussis, Thorsten Warneke, John R. Worden, Debra Wunch, Yuanzhi Yao, Jeongmin Yun, Andrew Zammit-Mangion & Ning Zeng
Accurate accounting of emissions and removals of CO2 is critical for the planning and verification of emission reduction targets in support of the Paris Agreement. Here, we present a pilot dataset of country-specific net carbon exchange (NCE; fossil plus terrestrial ecosystem fluxes) and terrestrial carbon stock changes aimed at informing countries’ carbon budgets. These estimates are based on “top-down” NCE outputs from the v10 Orbiting Carbon Observatory (OCO-2) modeling intercomparison project (MIP), wherein an ensemble of inverse modeling groups conducted standardized experiments assimilating OCO-2 column-averaged dry-air mole fraction () retrievals (ACOS v10), in situ CO2 measurements or combinations of these data. The v10 OCO-2 MIP NCE estimates are combined with “bottom-up” estimates of fossil fuel emissions and lateral carbon fluxes to estimate changes in terrestrial carbon stocks, which are impacted by anthropogenic and natural drivers. These flux and stock change estimates are reported annually (2015–2020) as both a global 1∘ × 1∘ gridded dataset and a country-level dataset and are available for download from the Committee on Earth Observation Satellites’ (CEOS) website: https://doi.org/10.48588/npf6-sw92 (Byrne et al., 2022). Across the v10 OCO-2 MIP experiments, we obtain increases in the ensemble median terrestrial carbon stocks of 3.29–4.58 Pg CO2 yr−1 (0.90–1.25 Pg C yr−1). This is a result of broad increases in terrestrial carbon stocks across the northern extratropics, while the tropics generally have stock losses but with considerable regional variability and differences between v10 OCO-2 MIP experiments. We discuss the state of the science for tracking emissions and removals using top-down methods, including current limitations and future developments towards top-down monitoring and verification systems. ![]()
A Carbon Monitoring Strategy through Near-real-time Data and Space Technology | The Innovation, November 3, 2022
![]()
Zhu Liu, Zhu Deng, Xiaoting Huang
In this Perspective, we proposed an innovative strategy that coupled the near-real-time emission data with the satellite observation to make a reliable and precise global carbon monitoring system. ![]()

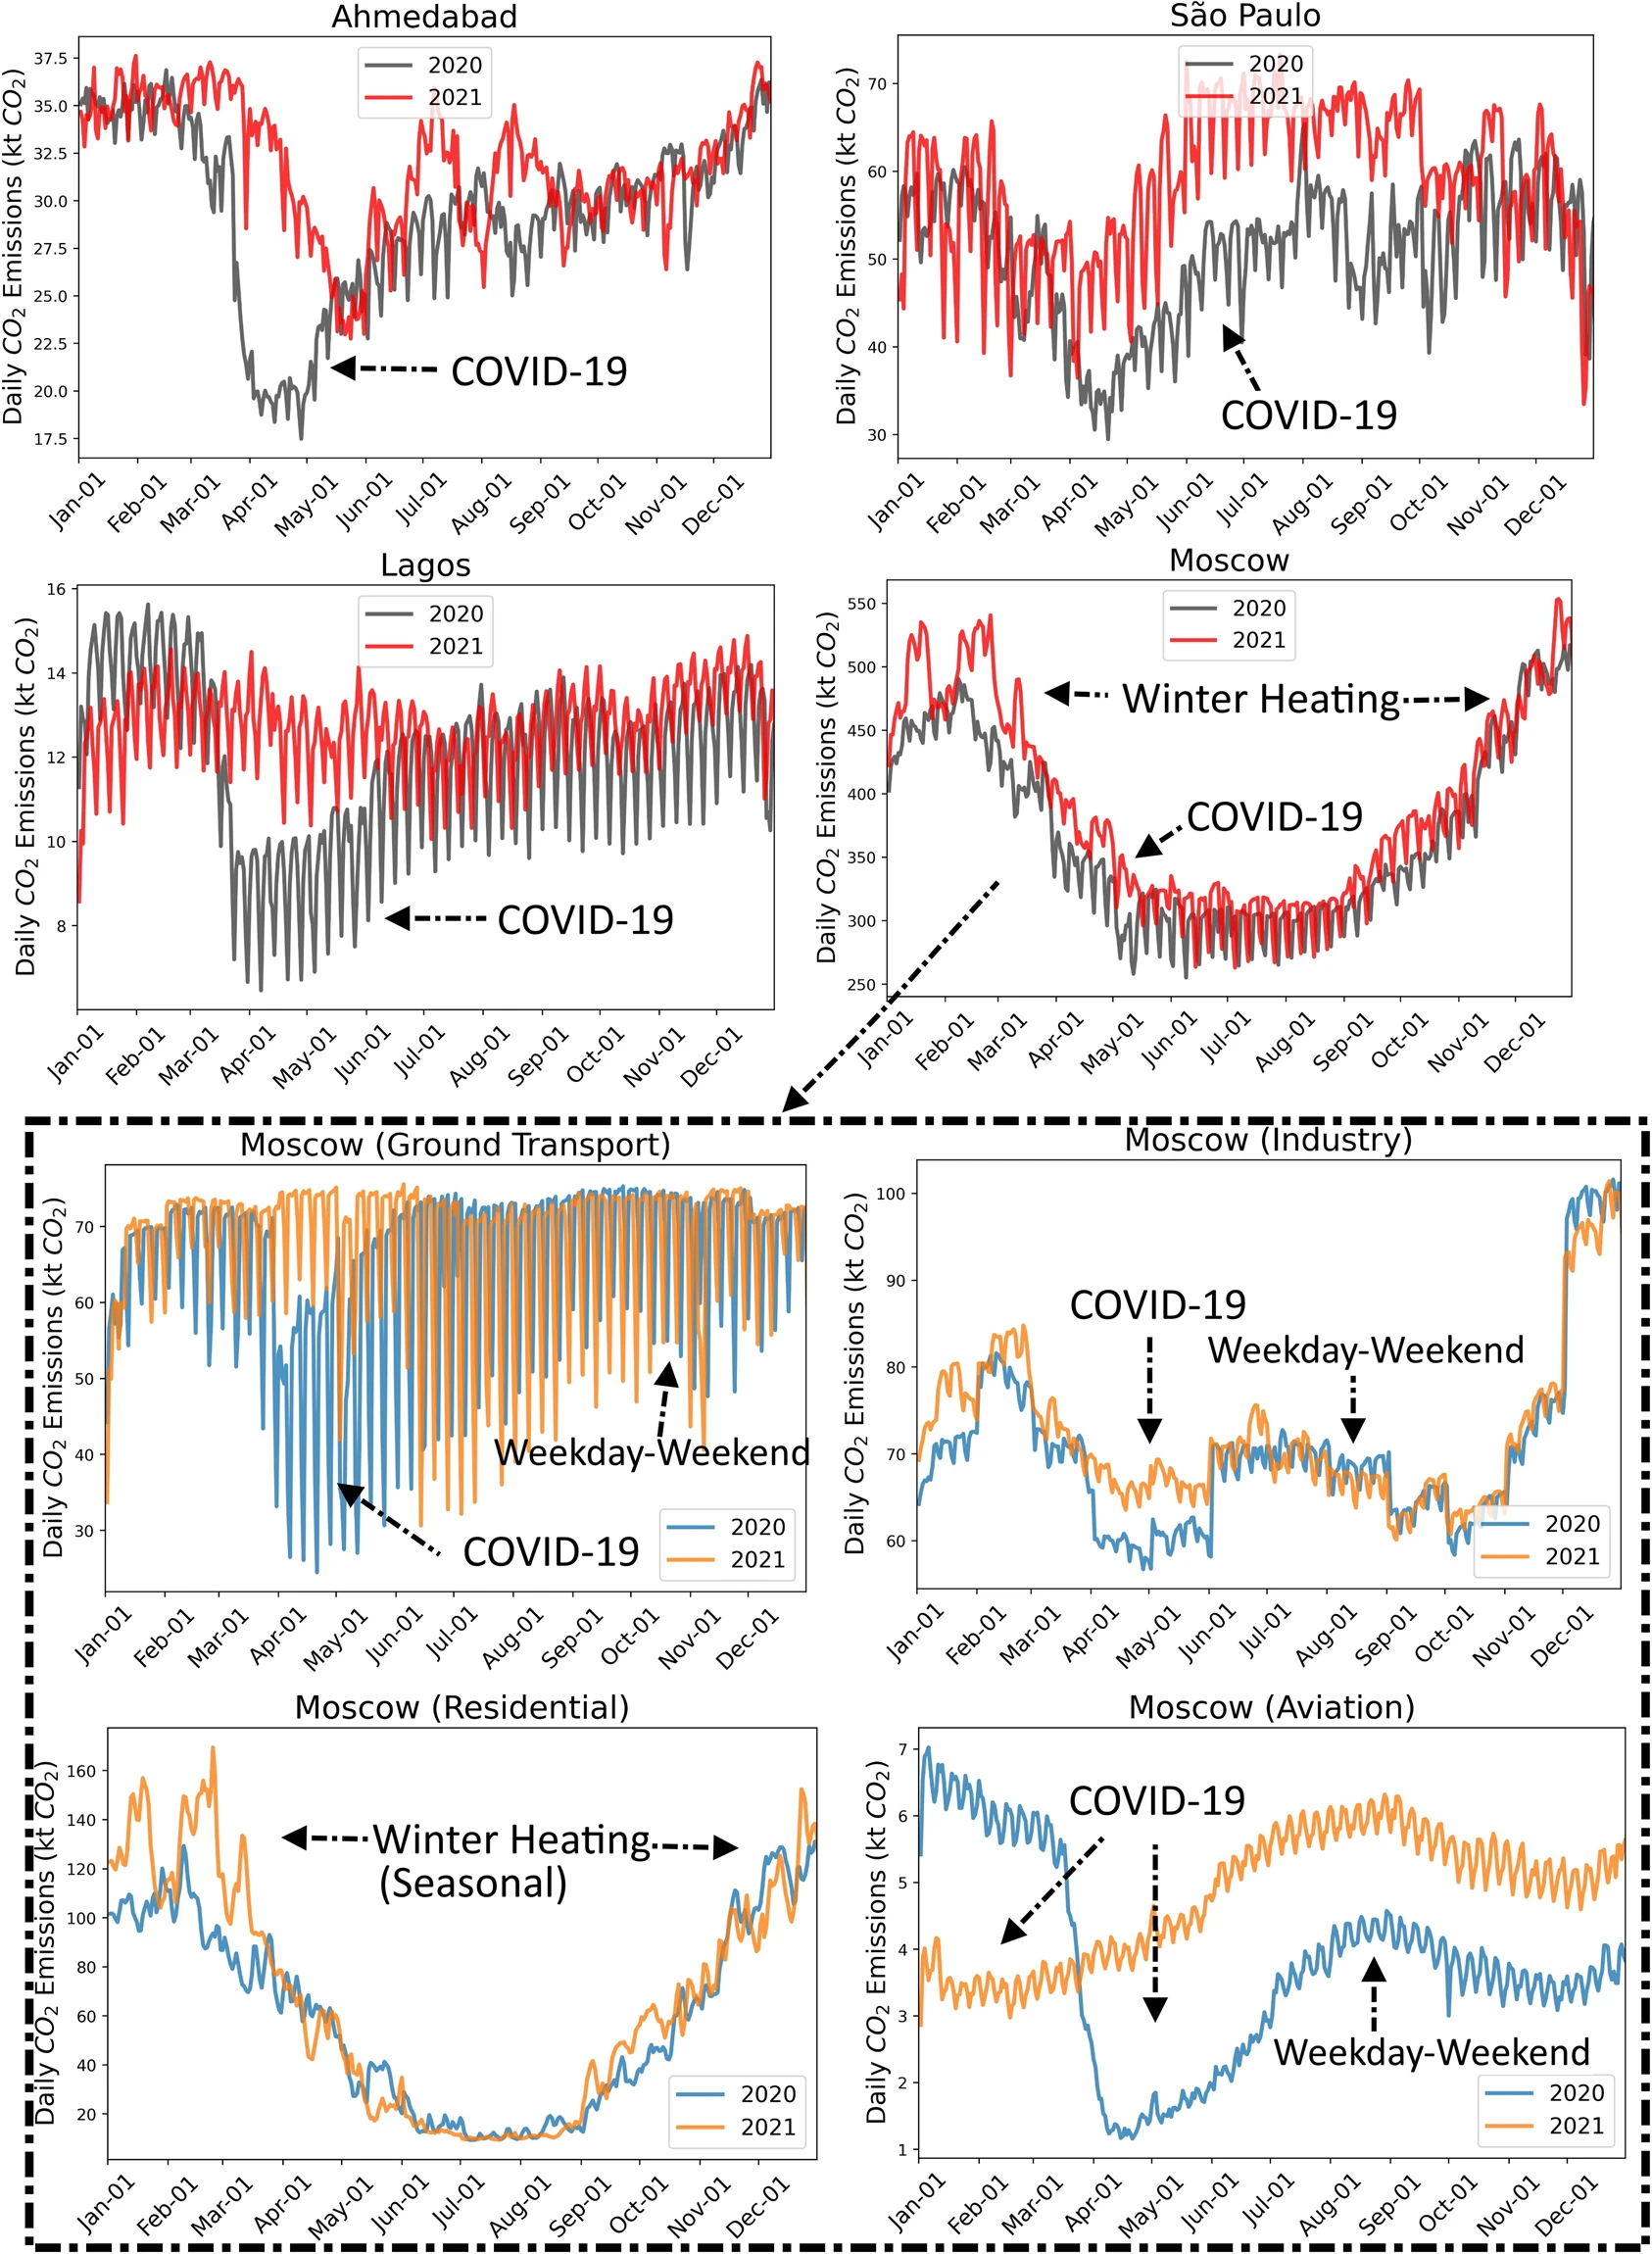
Global patterns of daily CO2 emissions rebound from the COVID-19 pandemic in the first year of COVID-19 | Nature Geoscience, June 30, 2022
![]()
Zhu Liu#,*, Zhu Deng#, Biqing Zhu, Philippe Ciais, Steven J. Davis, Jianguang Tan, Robbie M. Andrew, Olivier Boucher, Simon Ben Arous, Josep G. Canadell, Xinyu Dou, Pierre Friedlingstein, Pierre Gentine, Rui Guo, Chaopeng Hong, Robert B. Jackson, Daniel M. Kammen, Piyu Ke, Corinne Le Quéré, Crippa Monica, Greet Janssens-Maenhout, Glen P. Peters, Katsumasa Tanaka, Yilong Wang, Bo Zheng, Haiwang Zhong, Taochun Sun & Hans Joachim Schellnhuber
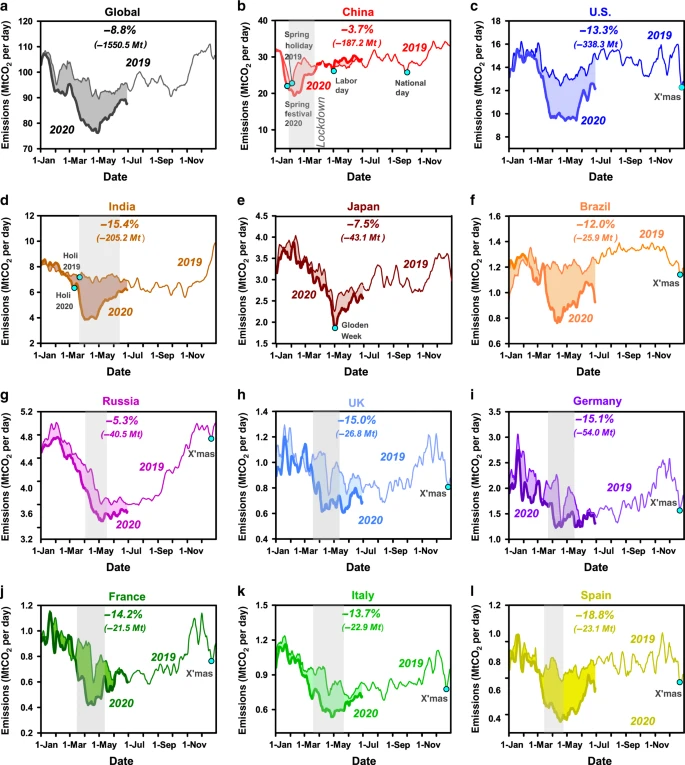
Day-to-day changes in CO2 emissions from human activities, in particular fossil-fuel combustion and cement production, reflect a complex balance of influences from seasonality, working days, weather and, most recently, the COVID-19 pandemic. Here, we provide a daily CO2 emissions dataset for the whole year of 2020, calculated from inventory and near-real-time activity data. We find a global reduction of 6.3% (2,232 MtCO2) in CO2emissions compared with 2019. The drop in daily emissions during the first part of the year resulted from reduced global economic activity due to the pandemic lockdowns, including a large decrease in emissions from the transportation sector. However, daily CO2 emissions gradually recovered towards 2019 levels from late April with the partial reopening of economic activity. Subsequent waves of lockdowns in late 2020 continued to cause smaller CO2 reductions, primarily in western countries. The extraordinary fall in emissions during 2020 is similar in magnitude to the sustained annual emissions reductions necessary to limit global warming at 1.5 °C. This underscores the magnitude and speed at which the energy transition needs to advance. ![]()

Comparing national greenhouse gas budgets reported in UNFCCC inventories against atmospheric inversions | Earth System Science Data, April 11, 2022
![]()
Zhu Deng#, Philippe Ciais#,*, Zitely A Tzompa-Sosa, Marielle Saunois, Chunjing Qiu, Chang Tan, Taochun Sun, Piyu Ke, Yanan Cui, Katsumasa Tanaka, Xin Lin, Rona L Thompson, Hanqin Tian, Yuanzhi Yao, Yuanyuan Huang, Ronny Lauerwald, Atul K Jain, Xiaoming Xu, Ana Bastos, Stephen Sitch, Paul I Palmer, Thomas Lauvaux, Alexandre d’Aspremont, Clément Giron, Antoine Benoit, Benjamin Poulter, Jinfeng Chang, Ana Maria Roxana Petrescu, Steven J Davis, Zhu Liu*, Giacomo Grassi, Clément Albergel, Francesco N Tubiello, Lucia Perugini, Wouter Peters, Frédéric Chevallier
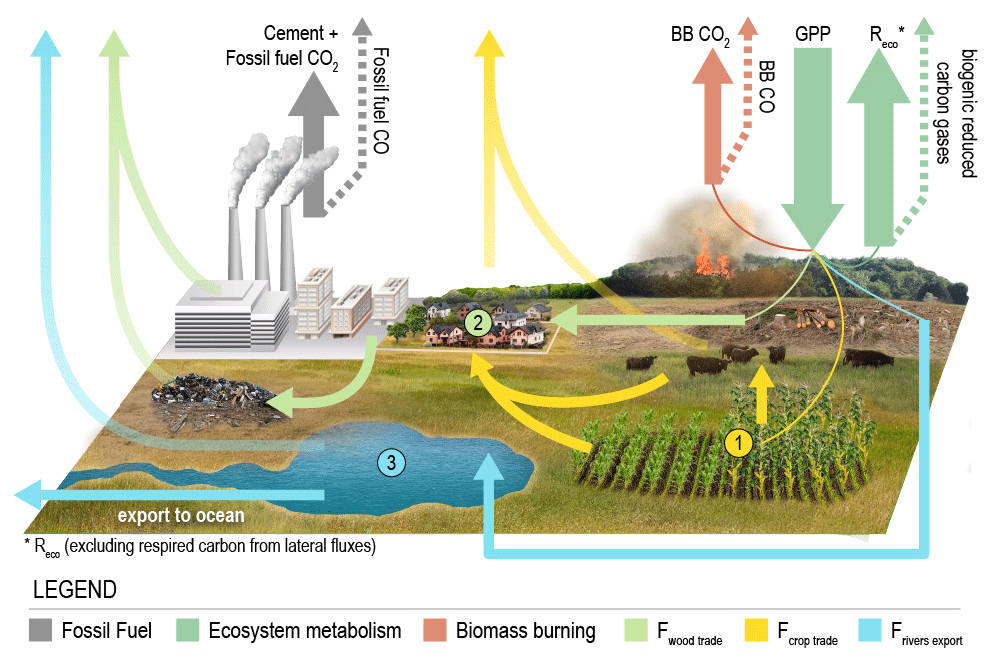
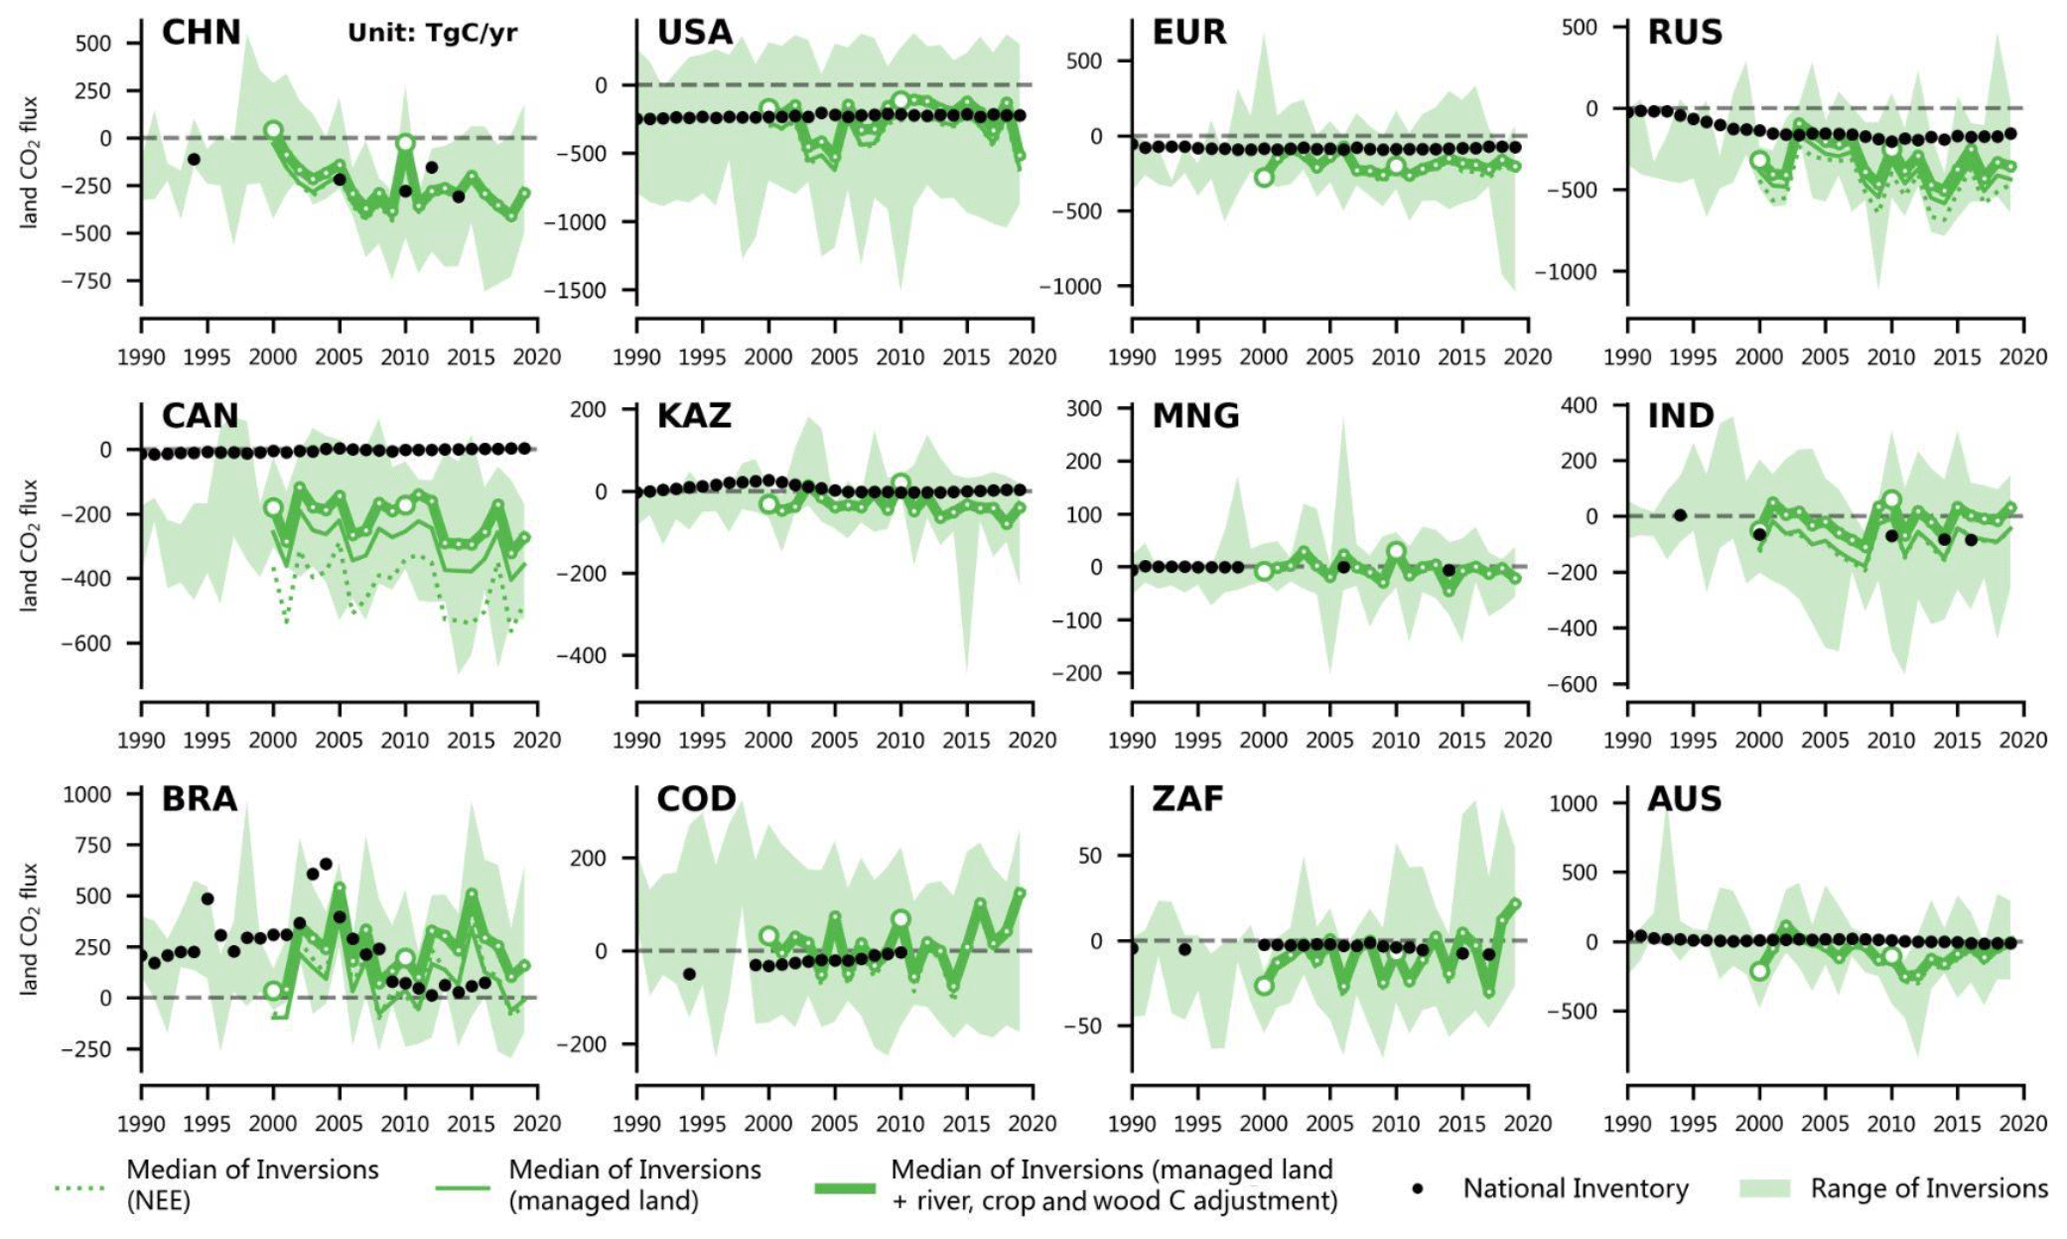
In support of the global stocktake of the Paris Agreement on climate change, this study presents a comprehensive framework to process the results of an ensemble of atmospheric inversions in order to make their net ecosystem exchange (NEE) carbon dioxide (CO2) flux suitable for evaluating national greenhouse gas inventories (NGHGIs) submitted by countries to the United Nations Framework Convention on Climate Change (UNFCCC). From inversions we also deduced anthropogenic methane (CH4) emissions regrouped into fossil and agriculture and waste emissions, as well as anthropogenic nitrous oxide (N2O) emissions. To compare inversion results with national reports, we compiled a new global harmonized database of emissions and removals from periodical UNFCCC inventories by Annex I countries, and from sporadic and less detailed emissions reports by non-Annex I countries, given by national communications and biennial update reports. No gap filling was applied. The method to reconcile inversions with inventories is applied to selected large countries covering ∼90 % of the global land carbon uptake for CO2 and top emitters of CH4and N2O. Our method uses results from an ensemble of global inversions produced by the Global Carbon Project for the three greenhouse gases, with ancillary data. We examine the role of CO2 fluxes caused by lateral transfer processes from rivers and from trade in crop and wood products and the role of carbon uptake in unmanaged lands, both not accounted for by NGHGIs. Here we show that, despite a large spread across the inversions, the median of available inversion models points to a larger terrestrial carbon sink than inventories over temperate countries or groups of countries of the Northern Hemisphere like Russia, Canada and the European Union. For CH4, we find good consistency between the inversions assimilating only data from the global in situ network and those using satellite CH4 retrievals and a tendency for inversions to diagnose higher CH4 emission estimates than reported by NGHGIs. In particular, oil- and gas-extracting countries in central Asia and the Persian Gulf region tend to systematically report lower emissions compared to those estimated by inversions. For N2O, inversions tend to produce higher anthropogenic emissions than inventories for tropical countries, even when attempting to consider only managed land emissions. In the inventories of many non-Annex I countries, this can be tentatively attributed to a lack of reporting indirect N2O emissions from atmospheric deposition and from leaching to rivers, to the existence of natural sources intertwined with managed lands, or to an underestimation of N2O emission factors for direct agricultural soil emissions. Inversions provide insights into seasonal and interannual greenhouse gas fluxes anomalies, e.g., during extreme events such as drought or abnormal fire episodes, whereas inventory methods are established to estimate trends and multi-annual changes. As a much denser sampling of atmospheric CO2and CH4 concentrations by different satellites coordinated into a global constellation is expected in the coming years, the methodology proposed here to compare inversion results with inventory reports (e.g., NGHGIs) could be applied regularly for monitoring the effectiveness of mitigation policy and progress by countries to meet the objective of their pledges. The dataset constructed by this study is publicly available at https://doi.org/10.5281/zenodo.5089799 (Deng et al., 2021). ![]()
Emissions rebound from the COVID-19 pandemic | Nature Climate Change, March 31, 2022
![]()
Steven J. Davis, Zhu Liu, Zhu Deng, Biqing Zhu, Piyu Ke, Taochun Sun, Rui Guo, Chaopeng Hong, Bo Zheng, Yilong Wang, Olivier Boucher, Pierre Gentine, Philippe Ciais
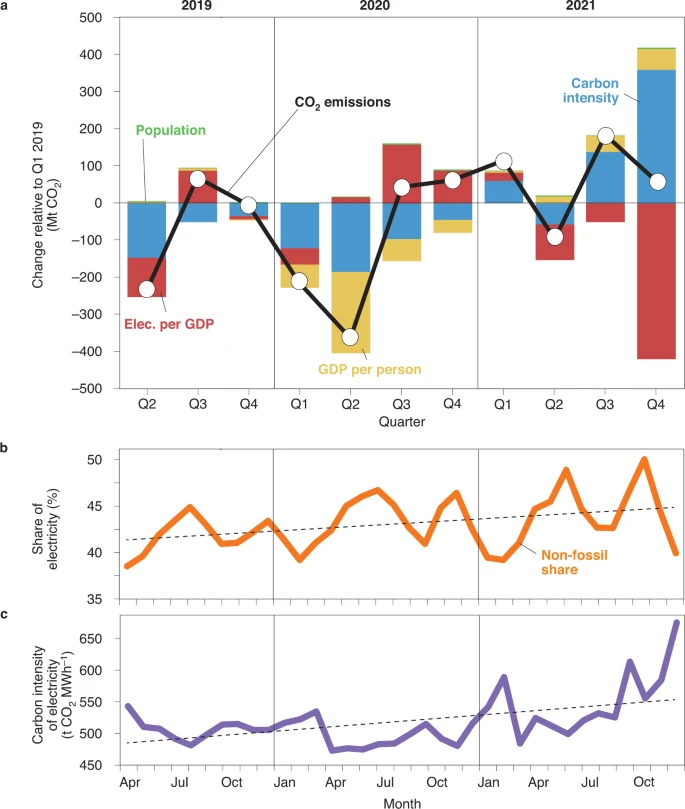
Global CO2 emissions in 2021 were only 1% less than the record levels of 2019, driven by increases in power- and industry-related emissions from China and India and a return of the carbon intensity of electricity to pre-pandemic levels. Is this resumed growth in fossil energy, or a final fleeting surge before a long decline? ![]()
Monitoring global carbon emissions in 2021 | Nature Reviews Earth & Environment, March 21, 2022
![]()
Zhu Liu, Zhu Deng, Steven J. Davis, Clement Giron, Philippe Ciais
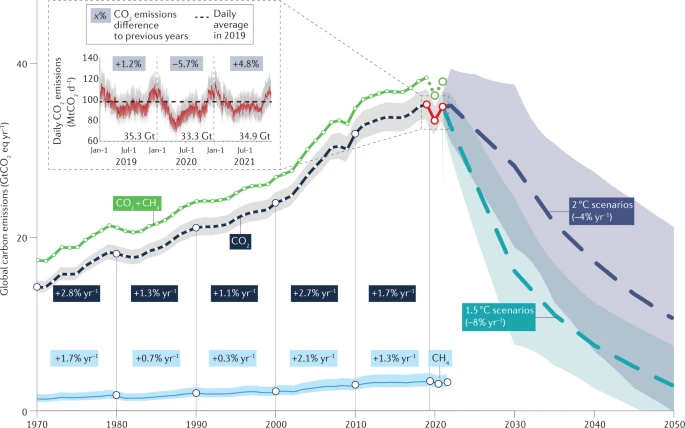
Following record-level declines in 2020, near-real-time data indicate that global CO2 emissions rebounded by 4.8% in 2021, reaching 34.9 GtCO2. These 2021 emissions consumed 8.7% of the remaining carbon budget for limiting anthropogenic warming to 1.5 °C, which if current trajectories continue, might be used up in 9.5 years at 67% likelihood. ![]()
Global fossil carbon emissions rebound near pre-COVID-19 levels | Environmental Research Letter, March 7, 2022
![]()
R B Jackson1, P Friedlingstein, C Le Quéré, S Abernethy1 R M Andrew, J G Canadell, P Ciais, S J Davis, Zhu Deng, Zhu Liu, J I Korsbakken and G P Peters
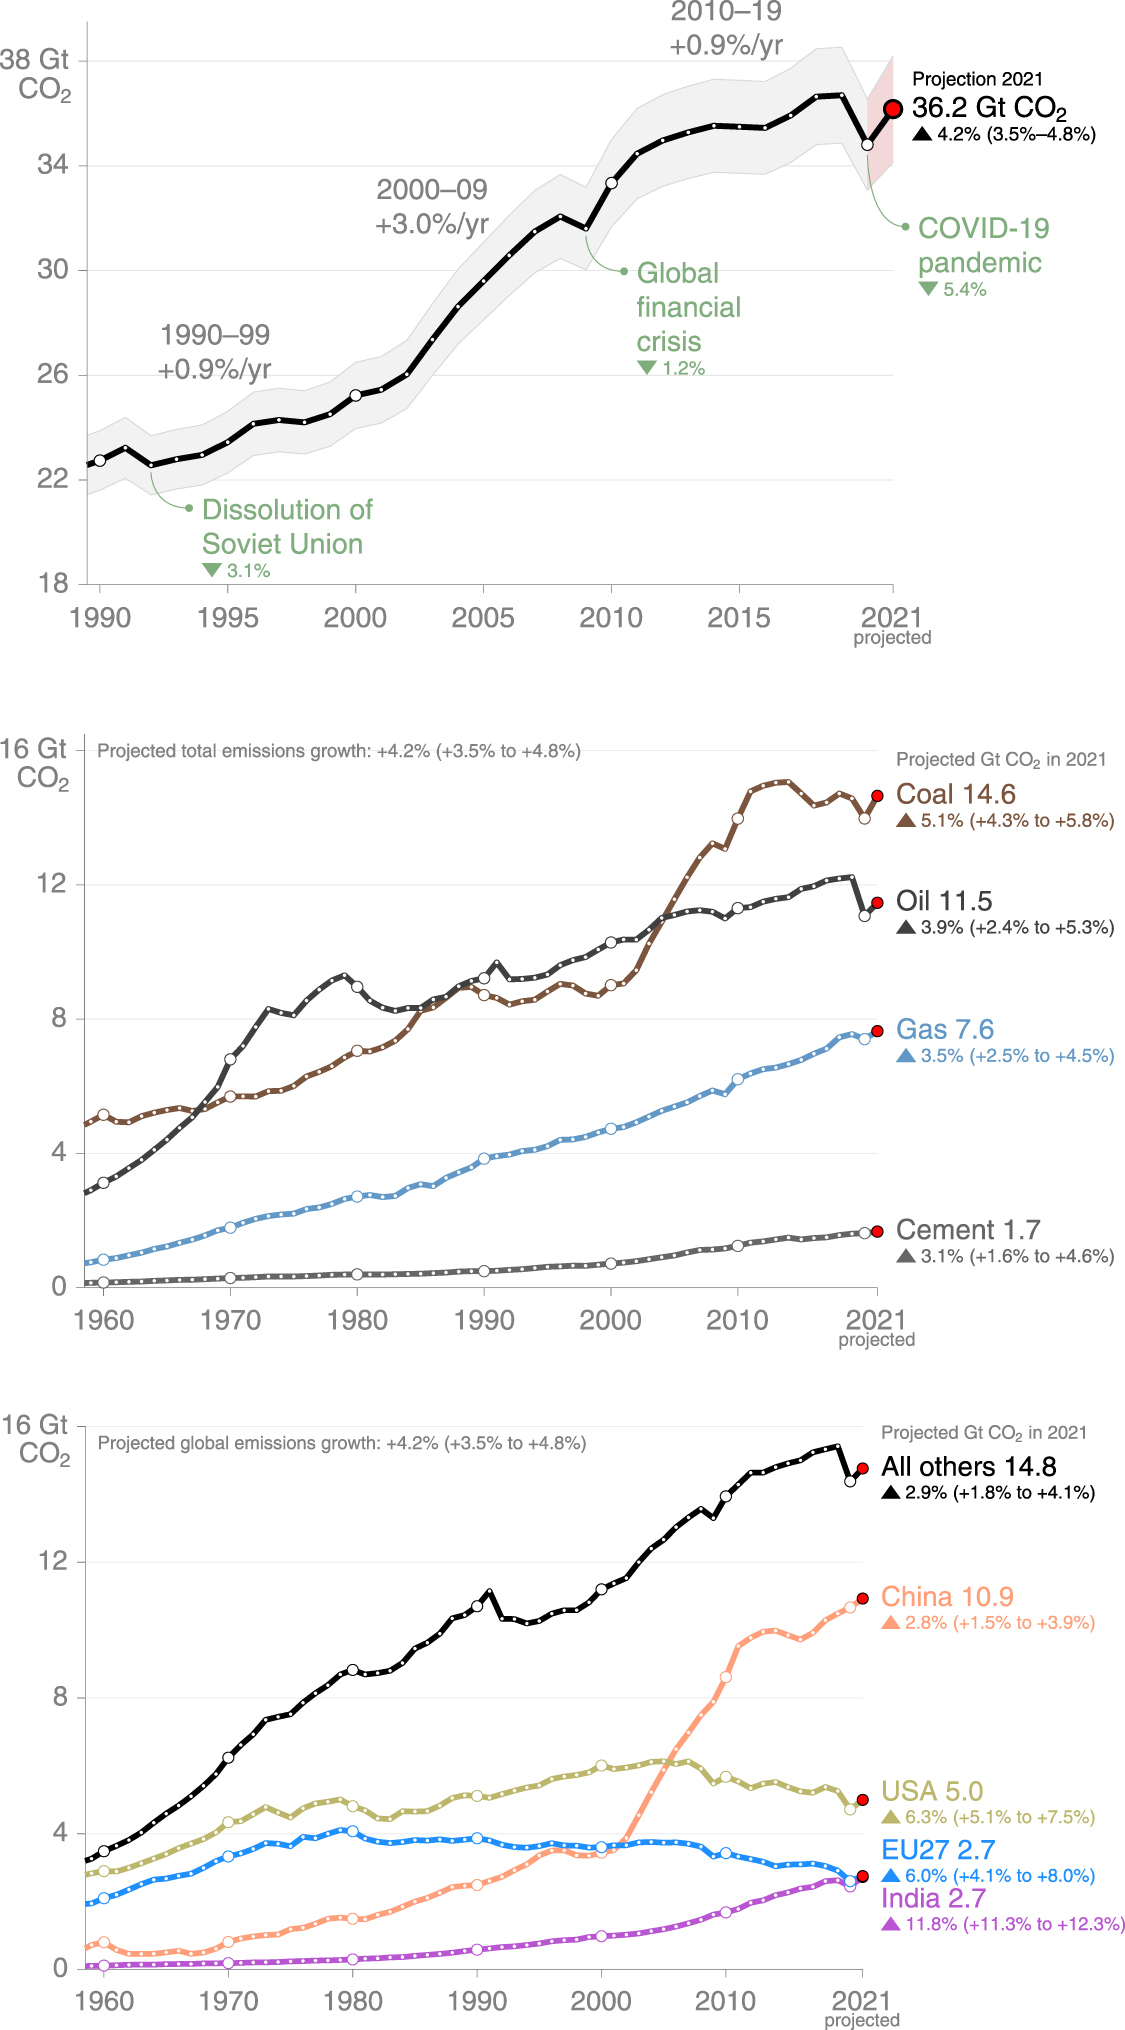
Fossil CO2 emissions in 2021 grew an estimated 4.2% (3.5%–4.8%) to 36.2 billion metric tons compared with 2020, pushing global emissions back close to 2019 levels (36.7 Gt CO2). ![]()
Challenges and opportunities for carbon neutrality in China | Nature Reviews Earth & Environment, December 21, 2021
![]()
Zhu Liu, Zhu Deng, Gang He, Hailin Wang, Xian Zhang, Jiang Lin, Ye Qi, Xi Liang
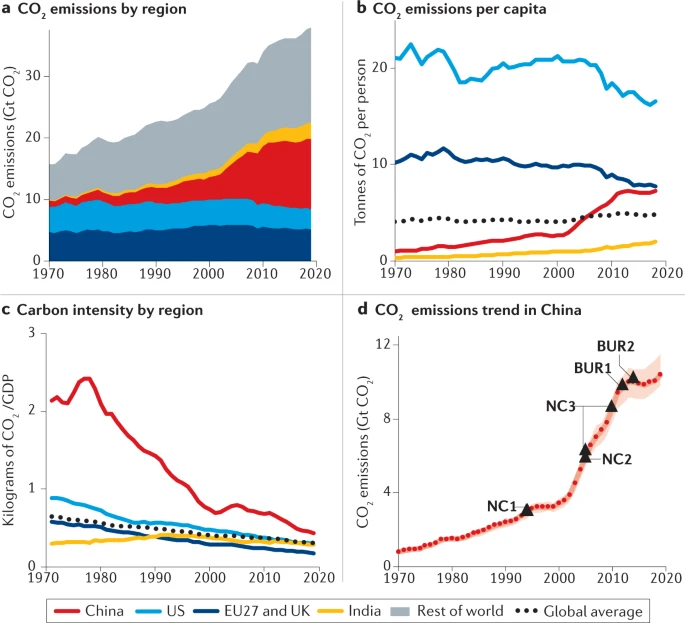
China is currently the world’s largest emitter of carbon dioxide (CO2). China therefore has a key role in global climate change mitigation. Policies and commitments are required to enable decarbonization. In this Perspective, we summarize the key features of China’s CO2emissions, its reduction processes and successes in meeting climate targets. China’s CO2emissions reductions have been substantial: by 2020, carbon intensity decreased by 48.4% compared to 2005 levels, achieving objectives outlined in the Nationally Appropriate Mitigation Actions and Nationally Determined Contributions. These reductions rely on the achievements of sectoral and sub-national targets outlined by China’s Five-Year Plans. However, China still faces the challenges of reaching its peak total CO2 emissions before 2030 and achieving carbon neutrality before 2060. Key steps towards China’s carbon neutrality include increasing its non-fossil energy share, deploying negative-emission technologies at large scale, promoting regional low-carbon development and establishing a nationwide ‘green market’. To achieve these steps, top-down socio-economic development plans must coincide with bottom-up economic incentives and technology development. ![]()
Impact of Lockdowns and Winter Temperatures on Natural Gas Consumption in Europe | Earth’s Future, December 11, 2021
![]()
Philippe Ciais, François-Marie Bréon, Stijn Dellaert, Yilong Wang, Katsumasa Tanaka, Léna Gurriaran, Yann Françoise, Steven J. Davis, Chaopeng Hong, Josep Penuelas, Ivan Janssens, Michael Obersteiner, Zhu Deng, Zhu Liu
As the COVID-19 virus spread over the world, governments restricted mobility to slow transmission. Public health measures had different intensities across European countries but all had significant impact on people’s daily lives and economic activities, causing a drop of CO2 emissions of about 10% for the whole year 2020. Here, we analyze changes in natural gas use in the industry and gas distribution to the built environment during the first half of year 2020 with daily gas flows data from pipeline and storage facilities in Europe. We find that reductions of industrial gas use reflect decreases in industrial production across most countries. Surprisingly, natural gas use in the built environment also decreased despite most people being confined at home and cold spells in March 2020. Those reductions that we attribute to the impacts of COVID-19 remain of comparable magnitude to previous variations induced by cold or warm climate anomalies in the cold season. We conclude that climate variations played a larger role than COVID-19 induced stay-home orders in natural gas consumption across Europe. ![]()

Near-real-time monitoring of global CO2 emissions reveals the effects of the COVID-19 pandemic | Nature Communications, October 14, 2020
![]()
Zhu Liu#,*, Philippe Ciais#, Zhu Deng#, Ruixue Lei, Steven J. Davis, Sha Feng, Bo Zheng, Duo Cui, Xinyu Dou, Biqing Zhu, Rui Guo, Piyu Ke, Taochun Sun, Chenxi Lu, Pan He, Yuan Wang, Xu Yue, Yilong Wang, Yadong Lei, Hao Zhou, Zhaonan Cai, Yuhui Wu, Runtao Guo, Tingxuan Han, Jinjun Xue, Olivier Boucher, Eulalie Boucher, Frédéric Chevallier, Katsumasa Tanaka, Yiming Wei, Haiwang Zhong, Chongqing Kang, Ning Zhang, Bin Chen, Fengming Xi, Miaomiao Liu, François-Marie Bréon, Yonglong Lu, Qiang Zhang, Dabo Guan, Peng Gong, Daniel M. Kammen, Kebin He & Hans Joachim Schellnhuber
The COVID-19 pandemic is impacting human activities, and in turn energy use and carbon dioxide (CO2) emissions. Here we present daily estimates of country-level CO2 emissions for different sectors based on near-real-time activity data. The key result is an abrupt 8.8% decrease in global CO2 emissions (−1551 Mt CO2) in the first half of 2020 compared to the same period in 2019. The magnitude of this decrease is larger than during previous economic downturns or World War II. The timing of emissions decreases corresponds to lockdown measures in each country. By July 1st, the pandemic’s effects on global emissions diminished as lockdown restrictions relaxed and some economic activities restarted, especially in China and several European countries, but substantial differences persist between countries, with continuing emission declines in the U.S. where coronavirus cases are still increasing substantially. ![]()
China’s non-fossil fuel CO2 emissions from industrial processes | Applied Energy, August 8, 2019
![]()
Duo Cui, Zhu Deng, Zhu Liu
China is the largest contributor of global CO2 emissions, to date more than quarter of the world total CO2 is from China. Well known on the fossil fuel combustion and cement production as the major emission sources, however, “non-fossil fuel CO2 emissions” are rarely reported by literature (except the emission from cement production). As China becomes the center for global manufacturing, it is critical to understand the magnitude and dynamics of China’s non-fossil fuel CO2 emissions so effective mitigation policy can be addressed. Here we collected data for all kinds of industrial processes CO2 emissions, and based on available data we calculated the CO2 emissions from the production of lime, plate glass, ammonia, calcium carbide, soda ash, ethylene, ferroalloys, alumina, lead and zinc in 2003–2018. We found that China’s CO2 emissions from these ten industrial processes reached 466 Mt CO2 in 2016, which is equivalent to 5% of China’s total CO2 emissions (9000 Mt CO2) from fossil fuel combustion and cement production process. The 466 Mt CO2 is approximate to total fossil fuel CO2 emissions from Brazil, the world top 11 CO2 emitter. The CO2 emissions from these ten industrial production processes show a fast increase before 2014, and fluctuate in 2014–2018. Quantifying such emission is critical for understanding the global carbon budget and developing a suitable climate policy given the significant magnitude and recent dynamics of China’s non-fossil fuel CO2 emissions. ![]()

Near-real-time Data & Method
Monitoring and quantifying CO2 emissions of isolated power plants from space | Atmospheric Chemistry and Physics, June 15, 2023
![]()
Xiaojuan Lin, Ronald van der A, Jos de Laat, Henk Eskes, Frédéric Chevallier, Philippe Ciais, Zhu Deng, Yuanhao Geng, Xuanren Song, Xiliang Ni, Da Huo, Xinyu Dou & Zhu Liu*
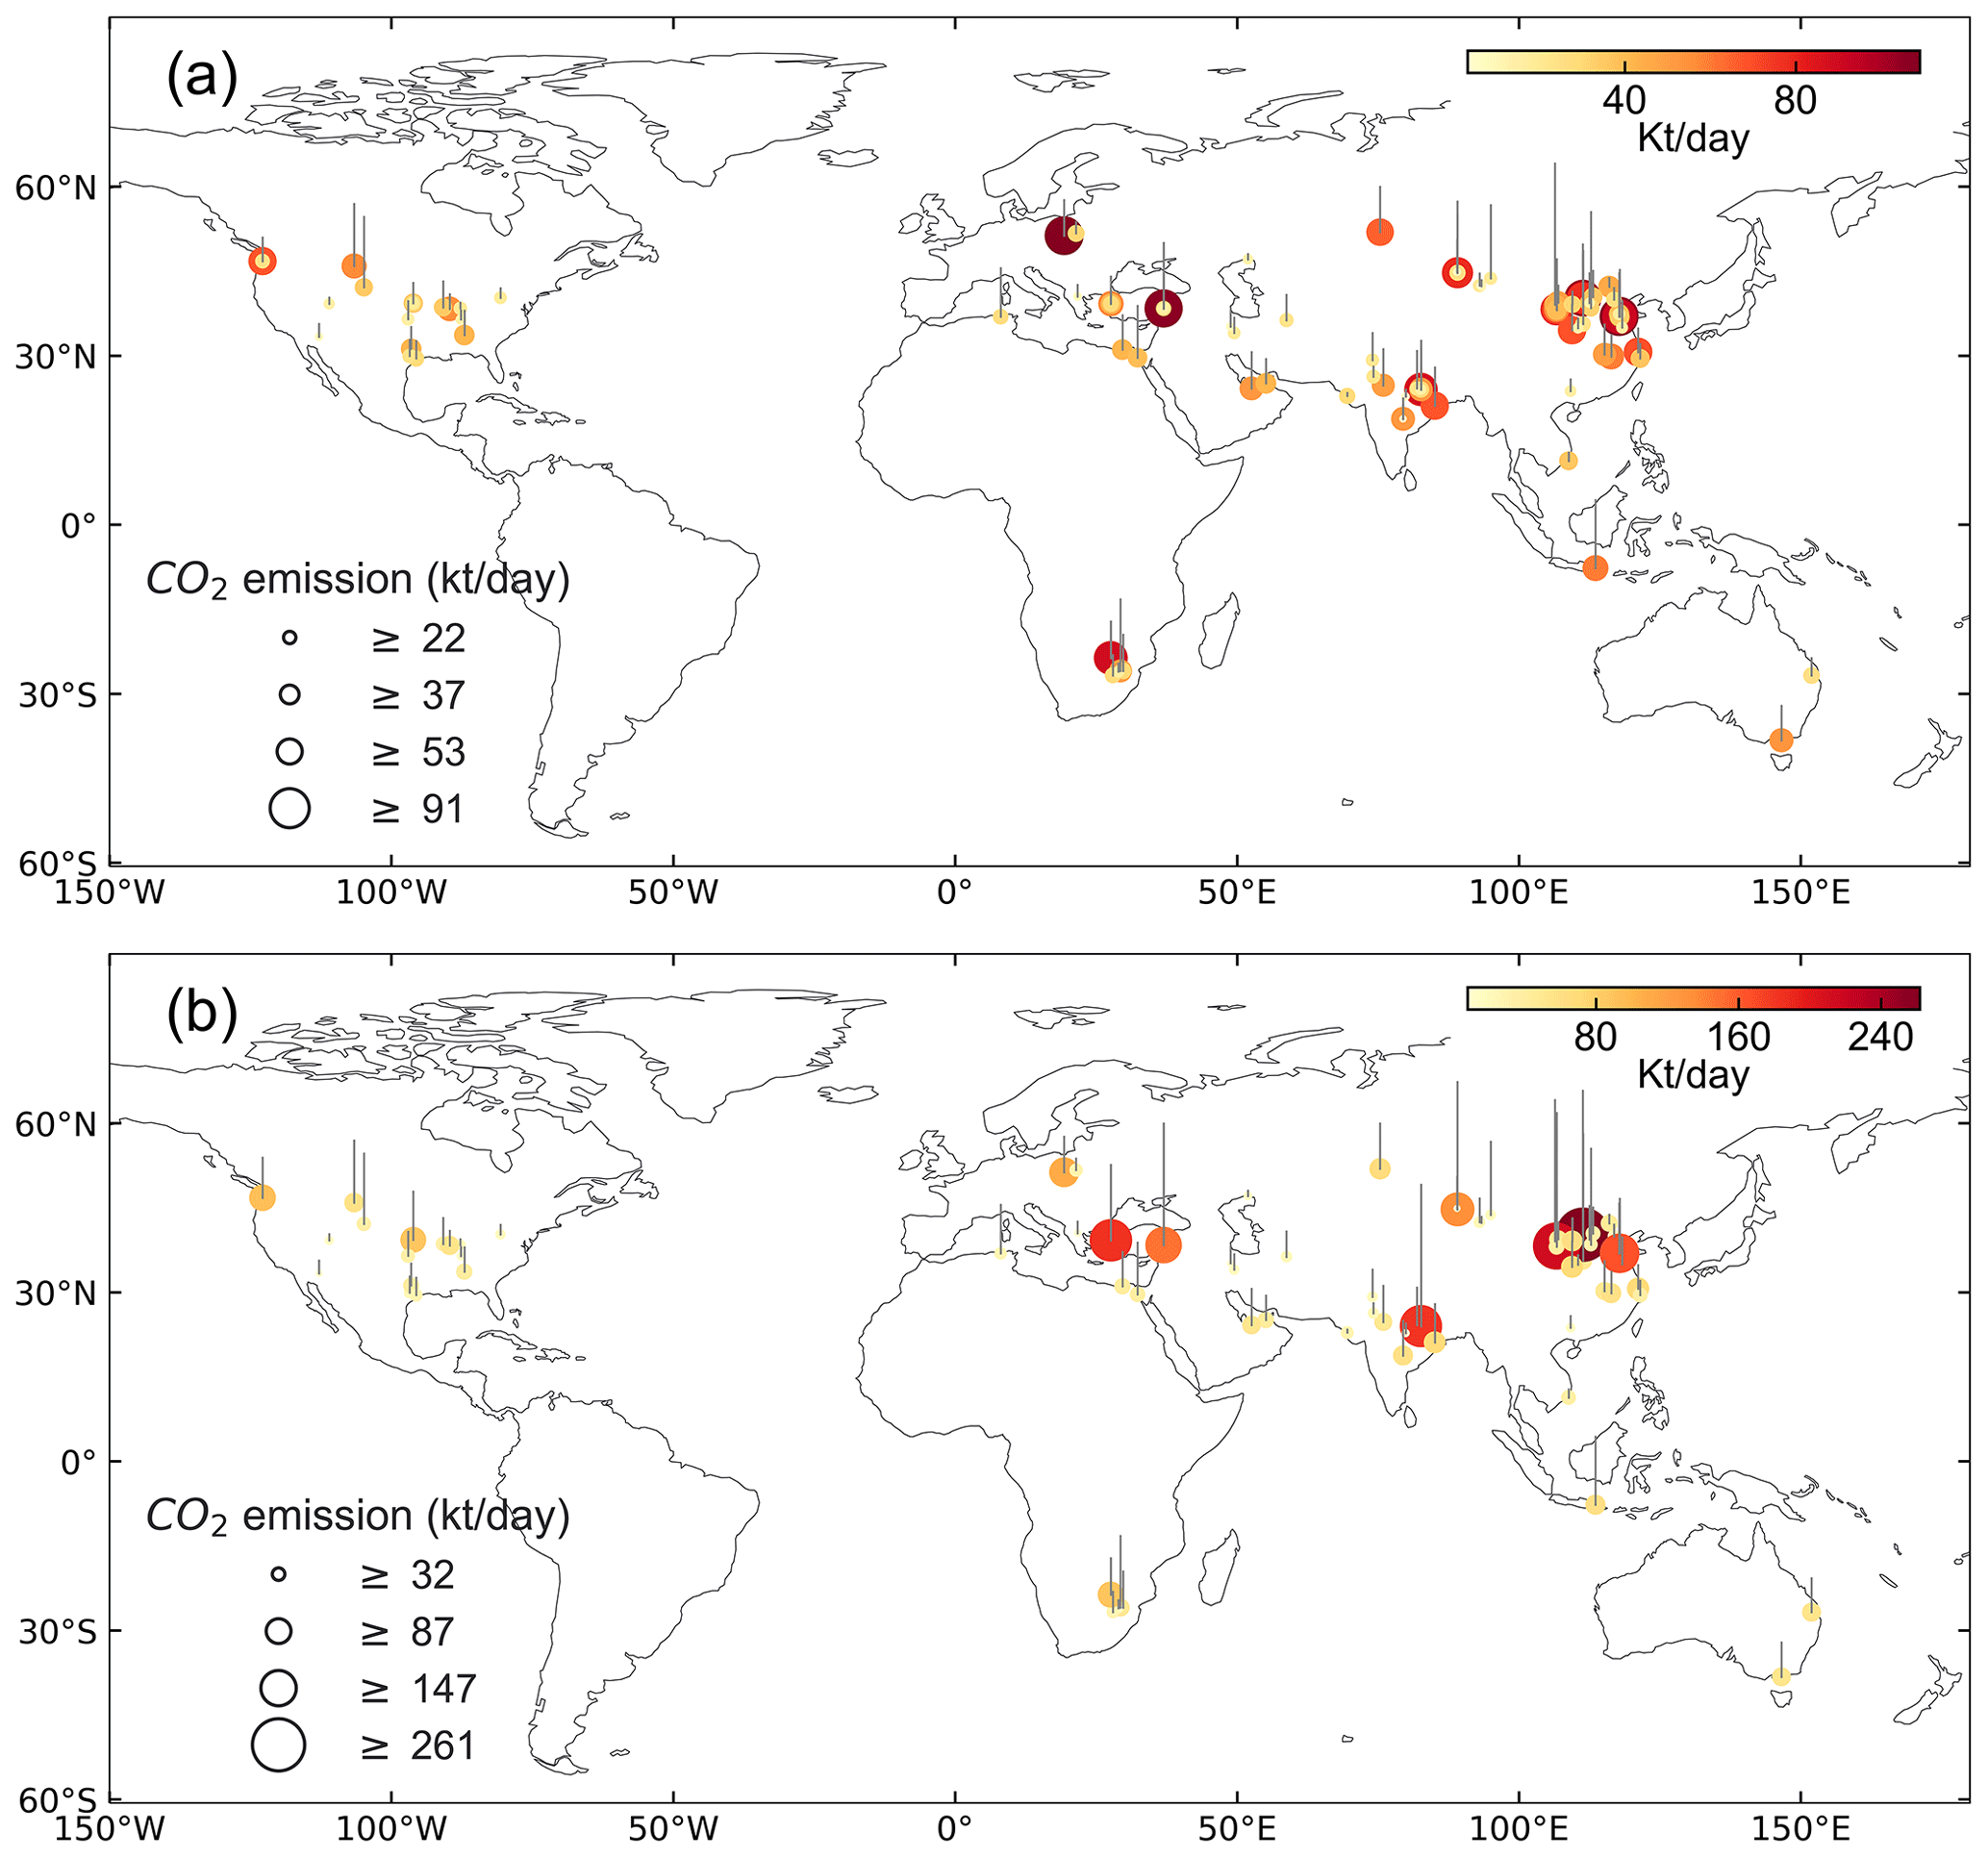
Top-down CO2 emission estimates based on satellite observations are of great importance for independently verifying the accuracy of reported emissions and emission inventories. Difficulties in verifying these satellite-derived emissions arise from the fact that emission inventories often provide annual mean emissions, while estimates from satellites are available only for a limited number of overpasses. Previous studies have derived CO2 emissions for power plants from the Orbiting Carbon Observatory-2 and 3 (OCO-2 and OCO-3) satellite observations of their exhaust plumes, but the accuracy and the factors affecting these emissions are uncertain. Here we advance monitoring and quantifying point source carbon emissions by focusing on how to improve the accuracy of carbon emission using different wind data estimates. We have selected only isolated power plants for this study, to avoid complications linked to multiple sources in close proximity. We first compared the Gaussian plume model and cross-sectional flux methods for estimating CO2 emission of power plants. Then we examined the sensitivity of the emission estimates to possible choices for the wind field. For verification we have used power plant emissions that are reported on an hourly basis by the Environmental Protection Agency (EPA) in the US. By using the OCO-2 and OCO-3 observations over the past 4 years we identified emission signals of isolated power plants and arrived at a total of 50 collocated cases involving 22 power plants. We correct for the time difference between the moment of the emission and the satellite observation. We found the wind field halfway the height of the planetary boundary layer (PBL) yielded the best results. We also found that the instantaneous satellite estimated emissions of these 50 cases, and reported emissions display a weak correlation (R2=0.12). The correlation improves with averaging over multiple observations of the 22 power plants (R2=0.40). The method was subsequently applied to 106 power plant cases worldwide and yielded a total emission of 1522 ± 501 Mt CO2 yr−1, estimated to be about 17 % of the power sector emissions of our selected countries. The improved correlation highlights the potential for future planned satellite missions with a greatly improved coverage to monitor a significant fraction of global power plant emissions. ![]()
Carbon Monitor Europe near-real-time daily CO2 emissions for 27 EU countries and the United Kingdom | Scientific Data, June 8, 2023
![]()
Piyu Ke, Zhu Deng, Biqing Zhu, Bo Zheng, Yilong Wang, Olivier Boucher, Simon Ben Arous, Chuanlong Zhou, Robbie M. Andrew, Xinyu Dou, Taochun Sun, Xuanren Song, Zhao Li, Feifan Yan, Duo Cui, Yifan Hu, Da Huo, Jean-Pierre Chang, Richard Engelen, Steven J. Davis, Philippe Ciais & Zhu Liu
With the urgent need to implement the EU countries pledges and to monitor the effectiveness of Green Deal plan, Monitoring Reporting and Verification tools are needed to track how emissions are changing for all the sectors. Current official inventories only provide annual estimates of national CO2 emissions with a lag of 1+ year which do not capture the variations of emissions due to recent shocks including COVID lockdowns and economic rebounds, war in Ukraine. Here we present a near-real-time country-level dataset of daily fossil fuel and cement emissions from January 2019 through December 2021 for 27 EU countries and UK, which called Carbon Monitor Europe. The data are calculated separately for six sectors: power, industry, ground transportation, domestic aviation, international aviation and residential. Daily CO2 emissions are estimated from a large set of activity data compiled from different sources. The goal of this dataset is to improve the timeliness and temporal resolution of emissions for European countries, to inform the public and decision makers about current emissions changes in Europe.![]()

CarbonMonitor-Power near-real-time monitoring of global power generation on hourly to daily scales | Scientific Data, April 17, 2023
![]()
Biqing Zhu#, Zhu Deng#, Xuanren Song#, Wenli Zhao, Da Huo, Taochun Sun, Piyu Ke, Duo Cui, Chenxi Lu, Haiwang Zhong, Chaopeng Hong, Jian Qiu, Steven J. Davis, Pierre Gentine, Philippe Ciais & Zhu Liu*
We constructed a frequently updated, near-real-time global power generation dataset: CarbonMonitor-Power since January, 2016 at national levels with near-global coverage and hourly-to-daily time resolution. The data presented here are collected from 37 countries across all continents for eight source groups, including three types of fossil sources (coal, gas, and oil), nuclear energy and four groups of renewable energy sources (solar energy, wind energy, hydro energy and other renewables including biomass, geothermal, etc.). The global near-real-time power dataset shows the dynamics of the global power system, including its hourly, daily, weekly and seasonal patterns as influenced by daily periodical activities, weekends, seasonal cycles, regular and irregular events (i.e., holidays) and extreme events (i.e., the COVID-19 pandemic). The CarbonMonitor-Power dataset reveals that the COVID-19 pandemic caused strong disruptions in some countries (i.e., China and India), leading to a temporary or long-lasting shift to low carbon intensity, while it had only little impact in some other countries (i.e., Australia). This dataset offers a large range of opportunities for power-related scientific research and policy-making. ![]()
Near-real-time global gridded daily CO2 emissions 2021 | Scientific Data, February 2, 2023
![]()
Xinyu Dou, Jinpyo Hong, Philippe Ciais, Frédéric Chevallier, Feifan Yan, Ying Yu, Yifan Hu, Da Huo, Yun Sun, Yilong Wang, Steven J. Davis, Monica Crippa, Greet Janssens-Maenhout, Diego Guizzardi, Efisio Solazzo, Xiaojuan Lin, Xuanren Song, Biqing Zhu, Duo Cui, Piyu Ke, Hengqi Wang, Wenwen Zhou, Xia Huang, Zhu Deng & Zhu Liu*
We present a near-real-time global gridded daily CO2 emissions dataset (GRACED) throughout 2021. GRACED provides gridded CO2 emissions at a 0.1° × 0.1° spatial resolution and 1-day temporal resolution from cement production and fossil fuel combustion over seven sectors, including industry, power, residential consumption, ground transportation, international aviation, domestic aviation, and international shipping. GRACED is prepared from the near-real-time daily national CO2 emissions estimates (Carbon Monitor), multi-source spatial activity data emissions and satellite NO2 data for time variations of those spatial activity data. GRACED provides the most timely overview of emissions distribution changes, which enables more accurate and timely identification of when and where fossil CO2 emissions have rebounded and decreased. Uncertainty analysis of GRACED gives a grid-level two-sigma uncertainty of value of ±19.9% in 2021, indicating the reliability of GRACED was not sacrificed for the sake of higher spatiotemporal resolution that GRACED provides. Continuing to update GRACED in a timely manner could help policymakers monitor energy and climate policies’ effectiveness and make adjustments quickly. ![]()

Near-real-time daily estimates of fossil fuel CO2 emissions from major high-emission cities in China | Scientific Data, November 10, 2022
![]()
Da Huo, Kai Liu, Jianwu Liu, Yingjian Huang, Taochun Sun, Yun Sun, Caomingzhe Si, Jinjie Liu, Xiaoting Huang, Jian Qiu, Haijin Wang, Duo Cui, Biqing Zhu, Zhu Deng, Piyu Ke, Yuli Shan, Olivier Boucher, Grégoire Dannet, Gaoqi Liang, Junhua Zhao, Lei Chen, Qian Zhang, Philippe Ciais, Wenwen Zhou* & Zhu Liu*
Cities in China are on the frontline of low-carbon transition which requires monitoring city-level emissions with low-latency to support timely climate actions. Most existing CO2 emission inventories lag reality by more than one year and only provide annual totals. To improve the timeliness and temporal resolution of city-level emission inventories, we present Carbon Monitor Cities-China (CMCC), a near-real-time dataset of daily CO2 emissions from fossil fuel and cement production for 48 major high-emission cities in China. This dataset provides territory-based emission estimates from 2020-01-01 to 2021-12-31 for five sectors: power generation, residential (buildings and services), industry, ground transportation, and aviation. CMCC is developed based on an innovative framework that integrates bottom-up inventory construction and daily emission estimates from sectoral activities and models. Annual emissions show reasonable agreement with other datasets, and uncertainty ranges are estimated for each city and sector. CMCC provides valuable daily emission estimates that enable low-latency mitigation monitoring for cities in China. ![]()

Carbon Monitor Cities near-real-time daily estimates of CO2 emissions from 1500 cities worldwide | Scientific Data, September 1, 2022
![]()
Da Huo, Xiaoting Huang, Xinyu Dou, Philippe Ciais, Yun Li, Zhu Deng, Yilong Wang, Duo Cui, Fouzi Benkhelifa, Taochun Sun, Biqing Zhu, Geoffrey Roest, Kevin R. Gurney, Piyu Ke, Rui Guo, Chenxi Lu, Xiaojuan Lin, Arminel Lovell, Kyra Appleby, Philip L. DeCola, Steven J. Davis & Zhu Liu
Building on near-real-time and spatially explicit estimates of daily carbon dioxide (CO2) emissions, here we present and analyze a new city-level dataset of fossil fuel and cement emissions, Carbon Monitor Cities, which provides daily estimates of emissions from January 2019 through December 2021 for 1500 cities in 46 countries, and disaggregates five sectors: power generation, residential (buildings), industry, ground transportation, and aviation. The goal of this dataset is to improve the timeliness and temporal resolution of city-level emission inventories and includes estimates for both functional urban areas and city administrative areas that are consistent with global and regional totals. Comparisons with other datasets (i.e. CEADs, MEIC, Vulcan, and CDP-ICLEI Track) were performed, and we estimate the overall annual uncertainty range to be ±21.7%. Carbon Monitor Cities is a near-real-time, city-level emission dataset that includes cities around the world, including the first estimates for many cities in low-income countries. ![]()
Near-Real-Time Carbon Emission Accounting Technology Toward Carbon Neutrality | Engineering, March 15, 2022
![]()
Zhu Liu, Taochun Sun, Ying Yu, Piyu Ke, Zhu Deng, Chenxi Lu, Da Huo, Xiang Ding
Climate change is the greatest environmental threat to humans and the planet in the 21st century. Global anthropogenic greenhouse gas emissions are one of the main causes of the increasing number of extreme climate events. Cumulative carbon dioxide (CO2) emissions showed a linear relationship with cumulative temperature rise since the pre-industrial stage, and this accounts for approximately 80% of the total anthropogenic greenhouse gases. Therefore, accurate and reliable carbon emission data are the foundation and scientific basis for most emission reduction policymaking and target setting. Currently, China has made clear the ambitious goal of achieving the peak of carbon emissions by 2030 and achieving carbon neutrality by 2060. The development of a finer-grained spatiotemporal carbon emission database is urgently needed to achieve more accurate carbon emission monitoring for continuous implementation and the iterative improvement of emission reduction policies. Near-real-time carbon emission monitoring is not only a major national demand but also a scientific question at the frontier of this discipline. This article reviews existing annual-based carbon accounting methods, with a focus on the newly developed real-time carbon emission technology and its current application trends. We also present a framework for the latest near-real-time carbon emission accounting technology that can be widely used. The development of relevant data and methods will provide strong database support to the policymaking for China’s “carbon neutrality” strategy. Finally, this article provides an outlook on the future of real-time carbon emission monitoring technology. ![]()

Near-real-time global gridded daily CO2 emissions | The Innovation, January 25, 2022
![]()
Xinyu Dou, Yilong Wang, Philippe Ciais, Frédéric Chevallier, Steven J Davis, Monica Crippa, Greet Janssens-Maenhout, Diego Guizzardi, Efisio Solazzo, Feifan Yan, Da Huo, Bo Zheng, Biqing Zhu, Duo Cui, Piyu Ke, Taochun Sun, Hengqi Wang, Qiang Zhang, Pierre Gentine, Zhu Deng, Zhu Liu
Precise and high-resolution carbon dioxide (CO2) emission data is of great importance in achieving carbon neutrality around the world. Here we present for the first time the near-real-time Global Gridded Daily CO2 Emissions Dataset (GRACED) from fossil fuel and cement production with a global spatial resolution of 0.1° by 0.1° and a temporal resolution of 1 day. Gridded fossil emissions are computed for different sectors based on the daily national CO2 emissions from near-real-time dataset (Carbon Monitor), the spatial patterns of point source emission dataset Global Energy Infrastructure Emissions Database (GID), Emission Database for Global Atmospheric Research (EDGAR), and spatiotemporal patters of satellite nitrogen dioxide (NO2) retrievals. Our study on the global CO2 emissions responds to the growing and urgent need for high-quality, fine-grained, near-real-time CO2 emissions estimates to support global emissions monitoring across various spatial scales. We show the spatial patterns of emission changes for power, industry, residential consumption, ground transportation, domestic and international aviation, and international shipping sectors from January 1, 2019, to December 31, 2020. This gives thorough insights into the relative contributions from each sector. Furthermore, it provides the most up-to-date and fine-grained overview of where and when fossil CO2 emissions have decreased and rebounded in response to emergencies (e.g., coronavirus disease 2019 [COVID-19]) and other disturbances of human activities of any previously published dataset. As the world recovers from the pandemic and decarbonizes its energy systems, regular updates of this dataset will enable policymakers to more closely monitor the effectiveness of climate and energy policies and quickly adapt. ![]()

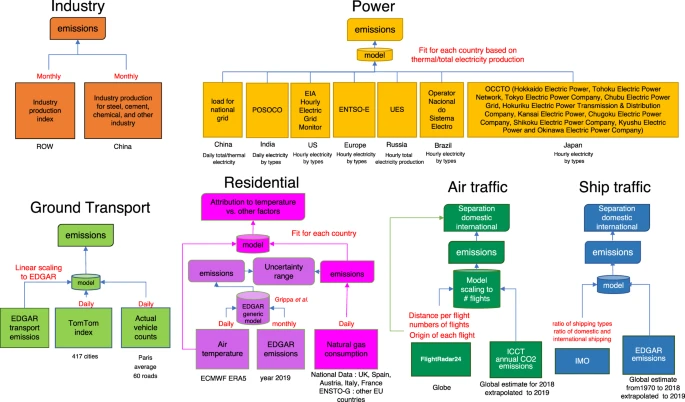
Carbon Monitor, a near-real-time daily dataset of global CO2 emission from fossil fuel and cement production | Scientific Data, November 9, 2020
![]()
Zhu Liu#,*, Philippe Ciais#,*, Zhu Deng#, Steven J. Davis*, Bo Zheng, Yilong Wang, Duo Cui, Biqing Zhu, Xinyu Dou, Piyu Ke, Taochun Sun, Rui Guo, Haiwang Zhong, Olivier Boucher, François-Marie Bréon, Chenxi Lu, Runtao Guo, Jinjun Xue, Eulalie Boucher, Katsumasa Tanaka & Frédéric Chevallier
We constructed a near-real-time daily CO2 emission dataset, the Carbon Monitor, to monitor the variations in CO2 emissions from fossil fuel combustion and cement production since January 1, 2019, at the national level, with near-global coverage on a daily basis and the potential to be frequently updated. Daily CO2 emissions are estimated from a diverse range of activity data, including the hourly to daily electrical power generation data of 31 countries, monthly production data and production indices of industry processes of 62 countries/regions, and daily mobility data and mobility indices for the ground transportation of 416 cities worldwide. Individual flight location data and monthly data were utilized for aviation and maritime transportation sector estimates. In addition, monthly fuel consumption data corrected for the daily air temperature of 206 countries were used to estimate the emissions from commercial and residential buildings. This Carbon Monitor dataset manifests the dynamic nature of CO2 emissions through daily, weekly and seasonal variations as influenced by workdays and holidays, as well as by the unfolding impacts of the COVID-19 pandemic. The Carbon Monitor near-real-time CO2 emission dataset shows a 8.8% decline in CO2 emissions globally from January 1st to June 30th in 2020 when compared with the same period in 2019 and detects a regrowth of CO2 emissions by late April, which is mainly attributed to the recovery of economic activities in China and a partial easing of lockdowns in other countries. This daily updated CO2 emission dataset could offer a range of opportunities for related scientific research and policy making. ![]()
Nexus
AutoPCF: A Novel Automatic Product Carbon Footprint Estimation Framework Based on Large Language Models | Proceedings of the AAAI Symposium Series, January 22, 2024
![]()
Biao Luo, Jinjie Liu, Zhu Deng, Can Yuan, Qingrun Yang, Lei Xiao, Yucong Xie, Fanke Zhou, Wenwen Zhou, Zhu Liu
Estimating the product carbon footprint (PCF) is crucial for sustainable consumption and supply chain decar-bonlization. The current life cycle assessment (LCA) methods frequently employed to evaluate PCFs often en-counter challenges, such as difficulties in determining the emission inventory and emission factors (EFs), as well as significant labor and time costs. To address these limitations, this paper presents AutoPCF, a novel auto-matic PCF estimation framework to conduct cradle-to-gate LCA for products. It utilizes deep learning models and large language models (LLMs) to automate and en-hance the estimation process. The framework comprises five stages: Emission Inventory Determination (EID), Activity Data Collection (ADC), Emission Factor Matching (EFM), Carbon Emission Estimation (CEE), and Estimation Verification and Evaluation (EVE). EID generates production processes and activity inventory, while ADC collects comprehensive activity data and EFM identifies accurate EFs. Emissions are then estimat-ed using the collected activity data and corresponding EFs. Experimental evaluations on steel, textile, and bat-tery products demonstrate the effectiveness of AutoPCF in improving the efficiency of PCF estimation. By auto-mating data collection and analysis, AutoPCF reduces re-liance on subjective decision-making and enhances the consistency and efficiency of carbon footprint assess-ments, advancing sustainable practices and supporting climate change mitigation efforts. ![]()
Population ageing and deaths attributable to ambient PM2·5 pollution: a global analysis of economic cost | The Lancet Planetary Health, June 1, 2021
![]()
Hao Yin, Michael Brauer, Junfeng Jim Zhang, Wenjia Cai, Ståle Navrud, Richard Burnett, Courtney Howard, Zhu Deng, Daniel M Kammen, Hans Joachim Schellnhuber, Kai Chen, Haidong Kan, Zhan-Ming Chen, Bin Chen, Ning Zhang, Zhifu Mi, D’Maris Coffman, Aaron J Cohen, Dabo Guan, Qiang Zhang, Peng Gong, Zhu Liu
The health impacts of ambient air pollution impose large costs on society. Although all people are exposed to air pollution, the older population (ie, those aged ≥60 years) tends to be disproportionally affected. As a result, there is growing concern about the health impacts of air pollution as many countries undergo rapid population ageing. We investigated the spatial and temporal variation in the economic cost of deaths attributable to ambient air pollution and its interaction with population ageing from 2000 to 2016 at global and regional levels. ![]()
